
Estimates from Sample Covariance
Contents
Estimates from Sample Covariance
The portfolios we constructed in this notebook serve as reference to the portfolios using cosine similarity estimates and factor model estimates. Here, we simply use the sample return and sample covariance to generate portfolios for each industry.
import pandas as pd
import numpy as np
import matplotlib.pyplot as plt
import seaborn as sns
r_selected = pd.read_csv("data/filtered_r.csv")
# get the mean of all
r_selected.set_index("name", inplace = True)
mu = r_selected.mean(axis = 1)
# compute the covariance matrix
cov = r_selected.T.cov()
Perform Mean-Variance Analysis
We will use one industry per time to generate a minimum-variance portfolio. In our demonstration of mean-variance analysis process, we use the industry pharmaceutical preparations whose SIC code is 2834. At the end, we will show the results for other industries.
We first get the name list of pharmaceutical preparations companies and match the names with the companies in returns data. Then, we get the sample mean and sample covariance for this specific industry. We get the efficient frontier, the set of optimal portfolios, for the industry; and recognize the minimum-variance portfolio with its performance and its weights for selected companies.
from pypfopt import EfficientFrontier
from pypfopt import risk_models
from pypfopt import expected_returns
from pypfopt import objective_functions
from pypfopt import plotting
df = pd.read_csv('../data/preprocessed.csv',
                 usecols = ['reportingDate', 'name', 'CIK',
                           'coDescription_stopwords', 'SIC', 'SIC_desc'])
df = df.set_index(df.name)
# get the names of the companies in the pharmaceutical preparations industry
Pharm = df[df.SIC == 2834]
Pharm_list = Pharm.index
# get the companies name that match return data and business description data
SET = (set(Pharm_list) & set(r_selected.index))
LIST = [*SET, ]
Sample Mean for the Pharmaceutical Preparations Industry
name
ALEXION PHARMACEUTICALS INC                   -0.007589
VALEANT PHARMACEUTICALS INTERNATIONAL, INC.    0.004328
ARENA PHARMACEUTICALS INC                      0.032450
THERAPEUTICSMD, INC.                          -0.016246
XENCOR INC                                     0.040986
                                                 ...
PFIZER INC                                     0.011145
TONIX PHARMACEUTICALS HOLDING CORP.           -0.091454
ENANTA PHARMACEUTICALS INC                     0.043121
SYNTHETIC BIOLOGICS, INC.                     -0.117010
PROTHENA CORP PLC                             -0.022615
Length: 124, dtype: float64
Sample Covariance for the Pharmaceutical Preparations Industry
| name | ALEXION PHARMACEUTICALS INC | VALEANT PHARMACEUTICALS INTERNATIONAL, INC. | ARENA PHARMACEUTICALS INC | THERAPEUTICSMD, INC. | XENCOR INC | AKORN INC | CONCERT PHARMACEUTICALS, INC. | AMICUS THERAPEUTICS INC | MERCK & CO., INC. | RXI PHARMACEUTICALS CORP | ... | PACIRA PHARMACEUTICALS, INC. | RETROPHIN, INC. | WAVE LIFE SCIENCES LTD. | SERES THERAPEUTICS, INC. | ATHERSYS, INC / NEW | PFIZER INC | TONIX PHARMACEUTICALS HOLDING CORP. | ENANTA PHARMACEUTICALS INC | SYNTHETIC BIOLOGICS, INC. | PROTHENA CORP PLC |
|---|---|---|---|---|---|---|---|---|---|---|---|---|---|---|---|---|---|---|---|---|---|
| name | |||||||||||||||||||||
| ALEXION PHARMACEUTICALS INC | 0.012712 | 0.006660 | 0.006930 | 0.005225 | 0.001170 | 0.007724 | -0.001042 | 0.006752 | 0.000882 | -0.002845 | ... | 0.003835 | 0.004225 | -0.003400 | 0.005804 | 0.001423 | 0.001644 | -0.000341 | 0.004035 | 0.007318 | 0.004338 |
| VALEANT PHARMACEUTICALS INTERNATIONAL, INC. | 0.006660 | 0.039376 | 0.009791 | 0.013252 | 0.001746 | 0.003388 | -0.000155 | 0.008508 | 0.003592 | 0.005348 | ... | 0.014738 | -0.001323 | 0.006341 | 0.008791 | 0.004323 | 0.001972 | 0.018120 | 0.002381 | 0.003896 | 0.000611 |
| ARENA PHARMACEUTICALS INC | 0.006930 | 0.009791 | 0.016468 | 0.009590 | 0.005659 | 0.003093 | 0.002774 | 0.008793 | -0.000367 | 0.007589 | ... | -0.001459 | 0.006164 | 0.004010 | 0.009748 | 0.003847 | 0.000946 | -0.000497 | 0.006247 | 0.008589 | 0.004414 |
| THERAPEUTICSMD, INC. | 0.005225 | 0.013252 | 0.009590 | 0.022313 | 0.005284 | 0.005202 | 0.012489 | 0.005136 | 0.001250 | 0.014646 | ... | 0.008701 | 0.006256 | 0.012576 | 0.015942 | 0.011200 | 0.002476 | 0.008163 | 0.006193 | 0.002654 | 0.000172 |
| XENCOR INC | 0.001170 | 0.001746 | 0.005659 | 0.005284 | 0.022963 | 0.000706 | 0.003764 | -0.000624 | 0.000666 | 0.005584 | ... | -0.001834 | 0.006962 | 0.013082 | 0.010240 | 0.003081 | 0.001374 | -0.000513 | 0.002233 | -0.001098 | 0.002824 |
| ... | ... | ... | ... | ... | ... | ... | ... | ... | ... | ... | ... | ... | ... | ... | ... | ... | ... | ... | ... | ... | ... |
| PFIZER INC | 0.001644 | 0.001972 | 0.000946 | 0.002476 | 0.001374 | 0.002698 | 0.000957 | 0.000309 | 0.000939 | 0.000719 | ... | 0.002475 | 0.001162 | 0.001007 | 0.001630 | 0.002291 | 0.001698 | -0.000593 | 0.000069 | 0.000604 | 0.001456 |
| TONIX PHARMACEUTICALS HOLDING CORP. | -0.000341 | 0.018120 | -0.000497 | 0.008163 | -0.000513 | 0.002554 | 0.003213 | 0.005606 | 0.000483 | -0.004720 | ... | 0.004383 | -0.004944 | -0.003492 | 0.009418 | -0.000825 | -0.000593 | 0.065843 | 0.007495 | 0.007087 | 0.000283 |
| ENANTA PHARMACEUTICALS INC | 0.004035 | 0.002381 | 0.006247 | 0.006193 | 0.002233 | 0.006631 | 0.003183 | 0.005128 | 0.000286 | 0.004438 | ... | -0.004859 | 0.008284 | 0.000024 | 0.007459 | 0.003778 | 0.000069 | 0.007495 | 0.019068 | 0.006687 | 0.005810 |
| SYNTHETIC BIOLOGICS, INC. | 0.007318 | 0.003896 | 0.008589 | 0.002654 | -0.001098 | 0.017232 | -0.003878 | 0.012808 | -0.000625 | 0.003202 | ... | -0.002593 | 0.007492 | -0.001993 | 0.005251 | 0.008775 | 0.000604 | 0.007087 | 0.006687 | 0.047660 | 0.009052 |
| PROTHENA CORP PLC | 0.004338 | 0.000611 | 0.004414 | 0.000172 | 0.002824 | 0.016777 | 0.005445 | 0.015848 | 0.000710 | 0.011297 | ... | 0.000575 | 0.007092 | -0.005593 | -0.006159 | 0.005641 | 0.001456 | 0.000283 | 0.005810 | 0.009052 | 0.043454 |
124 rows × 124 columns
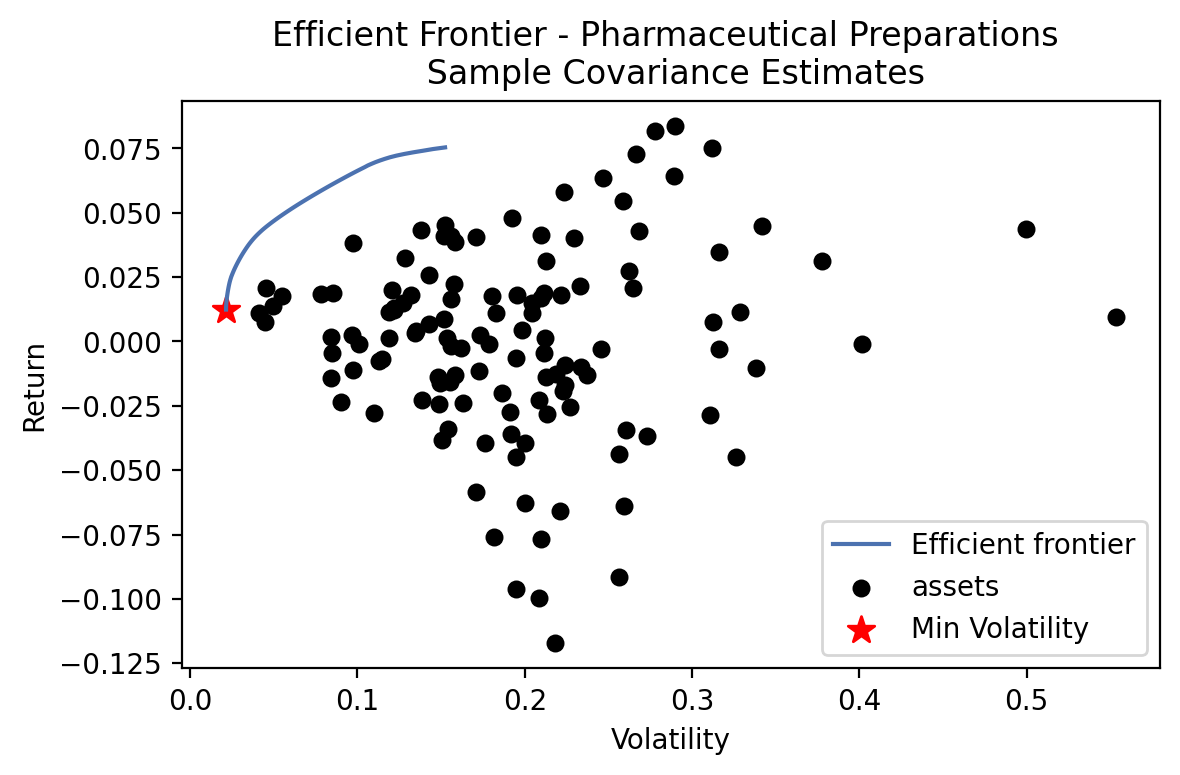
Efficient Frontier - Pharmaceutical Preparations
ef1 = EfficientFrontier(mu_Pharm, cov_Pharm, weight_bounds=(0, 0.2))

fig, ax = plt.subplots()
plotting.plot_efficient_frontier(ef1, ax=ax, show_assets=True)

# Find and plot the tangency portfolio
ef2 = EfficientFrontier(mu_Pharm, cov_Pharm, weight_bounds=(0, 0.2))
# min volatility
ef2.min_volatility()
ret_tangent, std_tangent, _ = ef2.portfolio_performance()
ax.scatter(std_tangent, ret_tangent, marker="*", s=100, c="r", label="Min Volatility")

# Format
ax.set_title("Efficient Frontier - Pharmaceutical Preparations \n Sample Covariance Estimates")
ax.legend()
plt.tight_layout()
plt.savefig('images/Efficient_Frontier_Sample_Pharmaceutical_Preparations.png', dpi=200, bbox_inches='tight')
plt.show()
Min Volatility Portfolio
Performance
ef2.portfolio_performance(verbose=True);
Expected annual return: 1.2%
Annual volatility: 2.1%
Sharpe Ratio: -0.35
Weights
companies = []
weights = []
for company, weight in ef2.clean_weights().items():
    if weight != 0:
        companies.append(company)
        weights.append(weight)

dic = {'Company_Name':companies,'Weight':weights}
min_vol = pd.DataFrame(dic)
min_vol.to_csv("data/min_vol_sample_Pharmaceutical_Preparations.csv", index = False)
pd.read_csv("data/min_vol_sample_Pharmaceutical_Preparations.csv")
| Company_Name | Weight | |
|---|---|---|
| 0 | MERCK & CO., INC. | 0.20000 |
| 1 | ACHAOGEN INC | 0.00515 |
| 2 | BRISTOL MYERS SQUIBB CO | 0.12824 |
| 3 | PROPHASE LABS, INC. | 0.05120 |
| 4 | HEAT BIOLOGICS, INC. | 0.00297 |
| 5 | CHEMBIO DIAGNOSTICS, INC. | 0.02843 |
| 6 | ORAMED PHARMACEUTICALS INC. | 0.04982 |
| 7 | ASSEMBLY BIOSCIENCES, INC. | 0.05775 |
| 8 | IMPRIMIS PHARMACEUTICALS, INC. | 0.04181 |
| 9 | MANNKIND CORP | 0.02048 |
| 10 | ARATANA THERAPEUTICS, INC. | 0.03678 |
| 11 | PFENEX INC. | 0.03777 |
| 12 | STEMLINE THERAPEUTICS INC | 0.04273 |
| 13 | RECRO PHARMA, INC. | 0.02010 |
| 14 | LIPOCINE INC. | 0.00683 |
| 15 | JOHNSON & JOHNSON | 0.17878 |
| 16 | BIODELIVERY SCIENCES INTERNATIONAL INC | 0.03680 |
| 17 | XENON PHARMACEUTICALS INC. | 0.01350 |
| 18 | ZOETIS INC. | 0.01195 |
| 19 | VTV THERAPEUTICS INC. | 0.02372 |
| 20 | CYTOMX THERAPEUTICS, INC. | 0.00520 |
Results for the Other 4 Industries
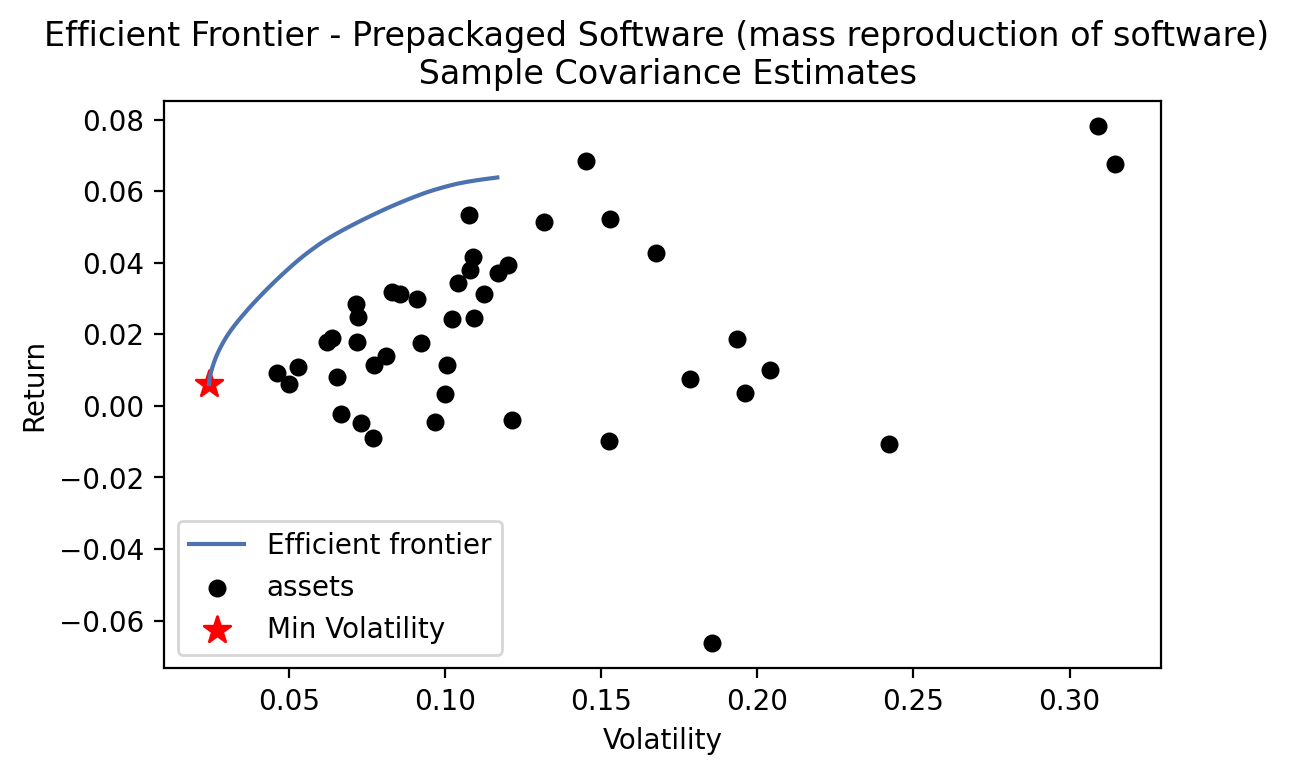
Prepackaged Software (mass reproduction of software)
Min Volatility Portfolio
Performance
Expected annual return: 0.6%
Annual volatility: 2.4%
Sharpe Ratio: -0.57
Weights
| Company_Name | Weight | |
|---|---|---|
| 0 | ORACLE CORP | 0.09170 |
| 1 | AVID TECHNOLOGY, INC. | 0.00129 |
| 2 | ZEDGE, INC. | 0.01792 |
| 3 | MAJESCO | 0.01906 |
| 4 | MICROSTRATEGY INC | 0.02160 |
| 5 | NUANCE COMMUNICATIONS, INC. | 0.08608 |
| 6 | QUMU CORP | 0.05153 |
| 7 | BLACK KNIGHT, INC. | 0.20000 |
| 8 | QUALYS, INC. | 0.06668 |
| 9 | AWARE INC /MA/ | 0.20000 |
| 10 | ENDURANCE INTERNATIONAL GROUP HOLDINGS, INC. | 0.02554 |
| 11 | LIVEPERSON INC | 0.01519 |
| 12 | COMMVAULT SYSTEMS INC | 0.07381 |
| 13 | ROSETTA STONE INC | 0.01647 |
| 14 | ACI WORLDWIDE, INC. | 0.11314 |
Crude Petroleum and Natural Gas
When we conduct the same analysis, there is no weight shown. Efficient frontier cannot be found.
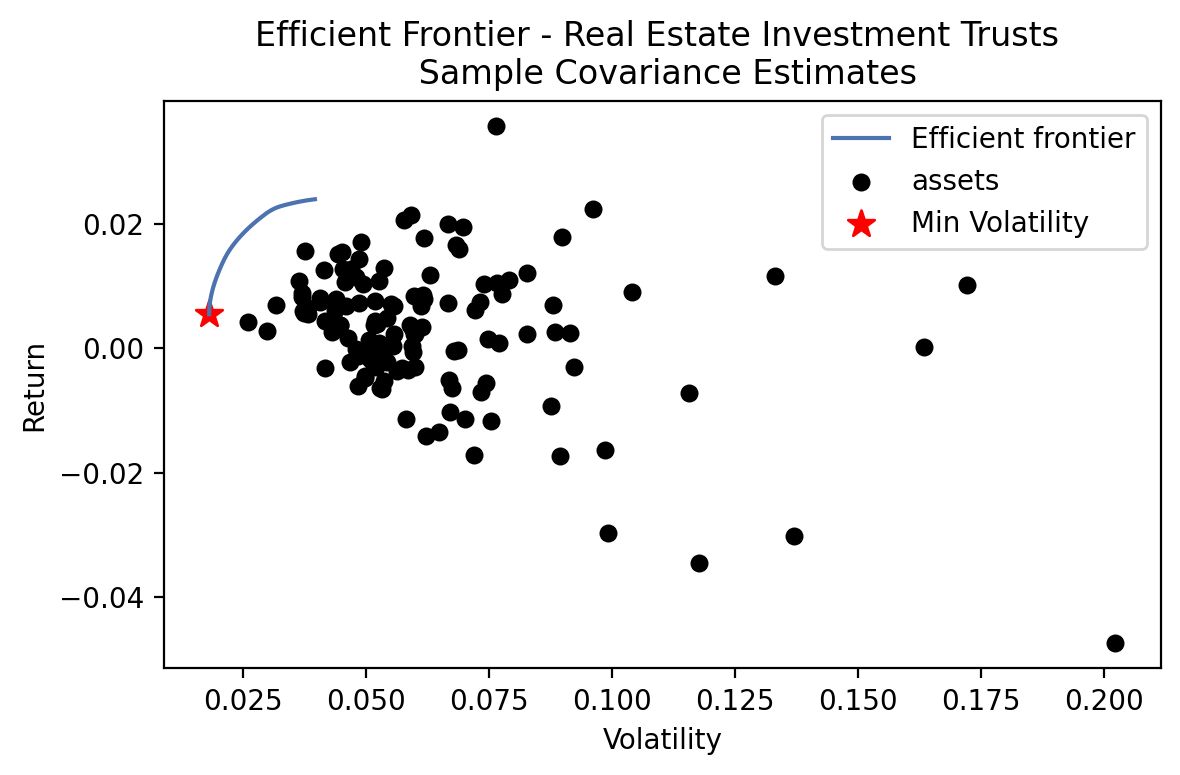
Real Estate Investment Trusts
Min Volatility Portfolio
Performance
Expected annual return: 0.5%
Annual volatility: 1.8%
Sharpe Ratio: -0.80
Weights
| Company_Name | Weight | |
|---|---|---|
| 0 | PUBLIC STORAGE | 0.10950 |
| 1 | GREAT AJAX CORP. | 0.20000 |
| 2 | CIM COMMERCIAL TRUST CORP | 0.05453 |
| 3 | MANHATTAN BRIDGE CAPITAL, INC | 0.01480 |
| 4 | BRT APARTMENTS CORP. | 0.01720 |
| 5 | ALEXANDERS INC | 0.02292 |
| 6 | LADDER CAPITAL CORP | 0.04406 |
| 7 | NEW YORK MORTGAGE TRUST INC | 0.02065 |
| 8 | ARES COMMERCIAL REAL ESTATE CORP | 0.09123 |
| 9 | CROWN CASTLE INTERNATIONAL CORP | 0.04853 |
| 10 | IMPAC MORTGAGE HOLDINGS INC | 0.05104 |
| 11 | HMG COURTLAND PROPERTIES INC | 0.12520 |
| 12 | EQUITY COMMONWEALTH | 0.20000 |
State Commercial Banks (commercial banking)
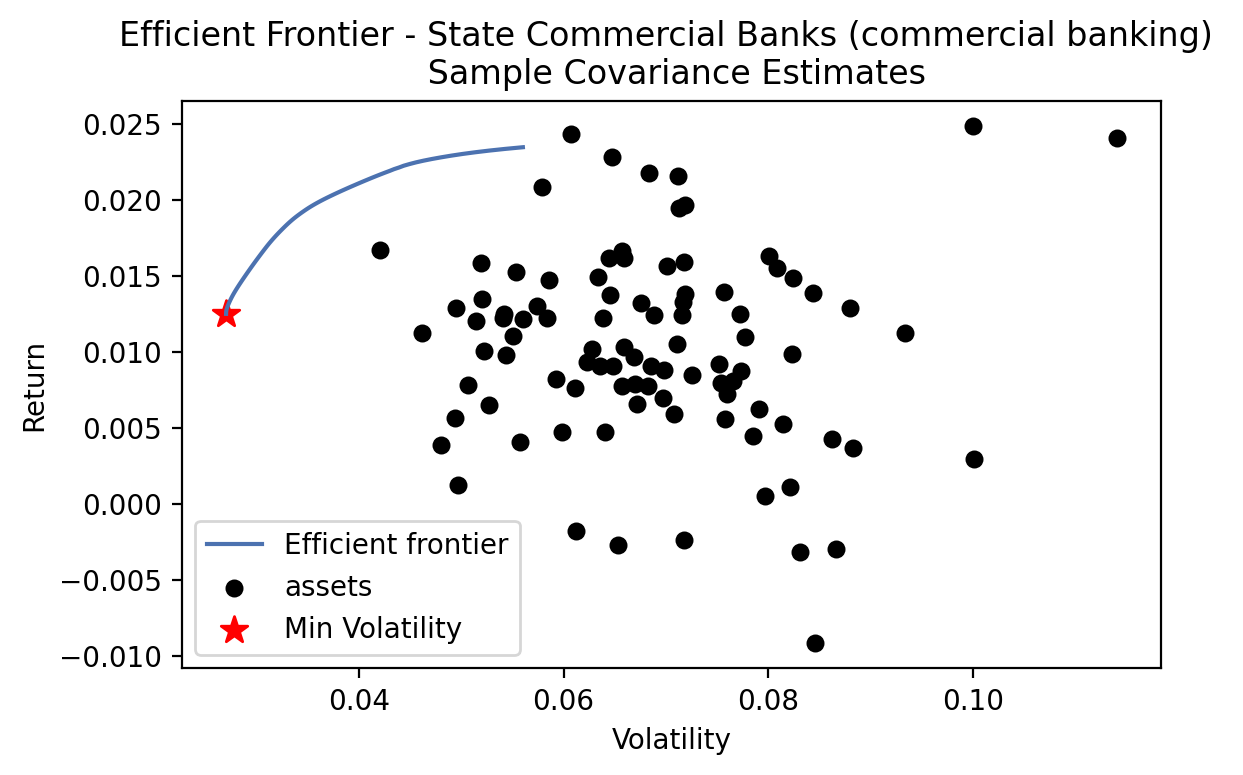
Min Volatility Portfolio
Performance
Weights
| Company_Name | Weight | |
|---|---|---|
| 0 | RELIANT BANCORP, INC. | 0.12273 |
| 1 | CAROLINA TRUST BANCSHARES, INC. | 0.11786 |
| 2 | BANK OF THE JAMES FINANCIAL GROUP INC | 0.00178 |
| 3 | BANK OF NEW YORK MELLON CORP | 0.09533 |
| 4 | FAUQUIER BANKSHARES, INC. | 0.02143 |
| 5 | MACKINAC FINANCIAL CORP /MI/ | 0.02478 |
| 6 | CITIZENS & NORTHERN CORP | 0.05375 |
| 7 | FIRST COMMUNITY CORP /SC/ | 0.05076 |
| 8 | INVESTAR HOLDING CORP | 0.19440 |
| 9 | VILLAGE BANK & TRUST FINANCIAL CORP. | 0.13994 |
| 10 | GUARANTY FEDERAL BANCSHARES INC | 0.17724 |