
Estimates from Factor Model
Contents
Estimates from Factor Model
We assume a factor model where there are \(k\) assets and \(T\) time periods (months in our case), m is the common factors (topic weights in our case). \(r_{it}\) is the return for asset \(i\) at time \(t\).
In our analysis, \(R_{k \times T}\) is the returns matrix imported, \(B_{k \times m}\) is the topic modeling matrix, and \(coef_{m \times T}\) is the coefficient matrix computed from the linear regression of returns matrix on topic modeling matrix. \(E_{k \times T}\) is the residual matrix.
In our factor model,
With the covariance developed from the factor model, we are able to convert the covariance into correlation matrix. Then, we use this correlation matrix and sample return standard deviation to calculate the estimated covariance.
import numpy as np
import pandas as pd
import matplotlib.pyplot as plt
import re
import json
import string
import nltk
from nltk.corpus import wordnet
from nltk.stem import WordNetLemmatizer
from nltk.tokenize import word_tokenize
from nltk.corpus import stopwords
r_selected = pd.read_csv("data/filtered_r.csv")
# get the mean of all
r_selected.set_index("name", inplace = True)
mu = r_selected.mean(axis = 1)
# compute the covariance matrix
cov = r_selected.T.cov()
df = pd.read_csv('../data/preprocessed.csv',
                 usecols = ['reportingDate', 'name', 'CIK', 'coDescription',
                           'coDescription_stopwords', 'SIC', 'SIC_desc'])
df = df.set_index(df.name)
Sent-LDA
We ran the coherence score benchmarking over a range of 3 to 40 topics, incrementing by 3.
First, we fit the LDA model to all business description using the number of topics selected from coherence score benchmarking.
Then, we assume each sentence only represents one topic; get the frequency of the topics revealed in the whole document (business description for one company) and calculate the probability of each topics in the whole document.
Coherence Score Plot
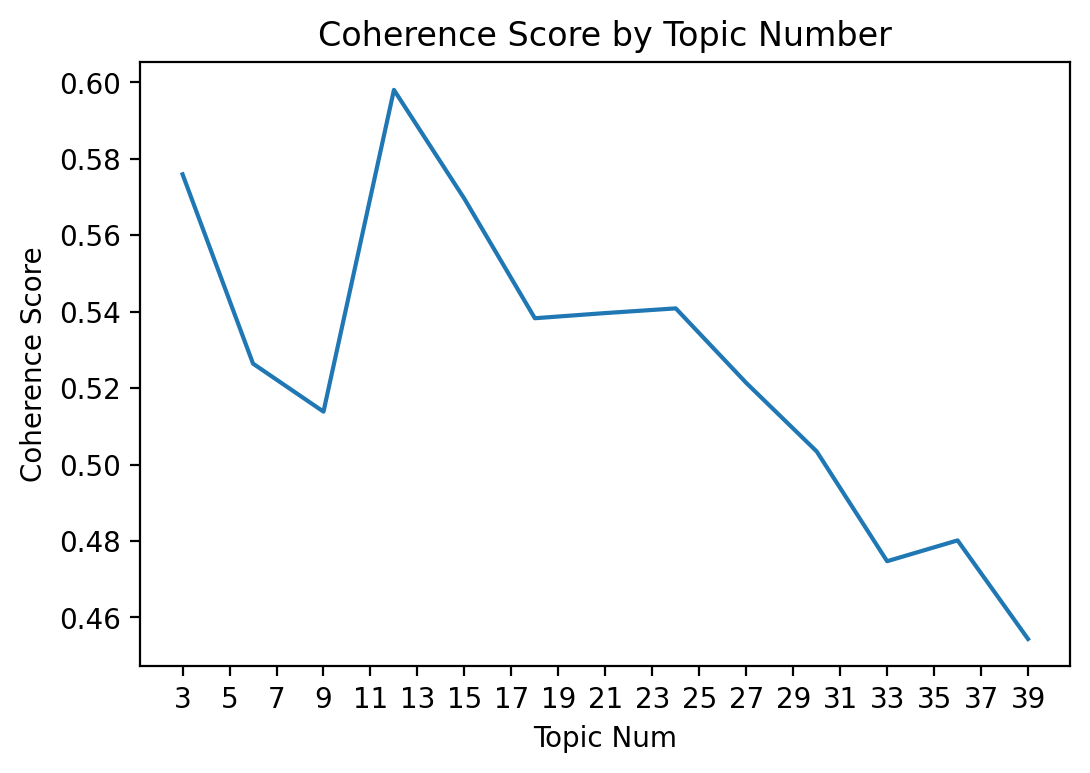
Based on the above Coherence Score, we choose up to 12 topics since it gives the highest score up to here.
data = df.loc[:,"coDescription_stopwords"].to_list()
from sklearn.feature_extraction.text import CountVectorizer
from sklearn.decomposition import LatentDirichletAllocation

# LDA can only use raw term counts for LDA because it is a probabilistic graphical model
tf_vectorizer = CountVectorizer(max_df=0.85, min_df=2, max_features=600)
tf = tf_vectorizer.fit_transform(data)
tf_feature_names = tf_vectorizer.get_feature_names_out()
lda = LatentDirichletAllocation(n_components=12, random_state=0).fit(tf)
We show the top 10 words by weights in the 12 topics LDA model generates in the below table.
std_func.get_topics(lda, tf_vectorizer, 12)
| Topic # 01 | Topic # 02 | Topic # 03 | Topic # 04 | Topic # 05 | Topic # 06 | Topic # 07 | Topic # 08 | Topic # 09 | Topic # 10 | Topic # 11 | Topic # 12 | |
|---|---|---|---|---|---|---|---|---|---|---|---|---|
| 0 | could | loan | share | product | investment | gas | hotel | patient | bank | customer | million | cell |
| 1 | gas | mortgage | stock | drug | income | oil | facility | treatment | capital | service | tax | cancer |
| 2 | regulation | real | note | fda | asset | natural | tenant | trial | institution | data | asset | tumor |
| 3 | oil | estate | issued | clinical | reit | production | lease | study | federal | product | net | product |
| 4 | future | commercial | preferred | patent | real | reserve | operating | phase | act | solution | income | therapy |
| 5 | natural | bank | date | approval | tax | proved | estate | clinical | banking | software | cash | therapeutic |
| 6 | price | interest | amount | trial | share | drilling | million | disease | holding | platform | expense | clinical |
| 7 | affect | rate | september | application | interest | regulation | real | drug | regulation | technology | value | technology |
| 8 | ability | million | per | regulatory | distribution | net | center | therapy | deposit | application | note | research |
| 9 | adversely | security | director | candidate | estate | water | portfolio | data | asset | sale | statement | license |
Frequency of the Topics in Each Sentence
n_components = 12
prob = pd.DataFrame(0, index = df.name, columns = range(n_components))
for j in range(len(df)):
    LIST_sent = pd.Series(df.coDescription[j].split('.')).apply(std_func.lemmatize_sentence).apply(std_func.remove_nums).apply(std_func.remove_stopwords)

    X = tf_vectorizer.transform(LIST_sent.tolist())
    sent = lda.transform(X)
    sent_df = pd.DataFrame(sent)
    # drop the values that are smaller than 1/12
    # if the maximum value is 1/12, the probability of each topic in that sentence is the same
    # we cannot determine which topic to choose
    sent_df = sent_df[sent_df.max(axis = 1) > 1/12].reset_index(drop = True)

    for i in range(n_components):
        prob.iloc[j][i] = list(sent_df.idxmax(axis = 1)).count(i)

    # calculate the probability
    prob = prob.div(prob.sum(axis=1), axis=0)
| 0 | 1 | 2 | 3 | 4 | 5 | 6 | 7 | 8 | 9 | 10 | 11 | |
|---|---|---|---|---|---|---|---|---|---|---|---|---|
| name | ||||||||||||
| MONGODB, INC. | 0.014652 | 0.007326 | 0.021978 | 0.036630 | 0.018315 | 0.010989 | 0.040293 | 0.021978 | 0.014652 | 0.739927 | 0.047619 | 0.025641 |
| SALESFORCE COM INC | 0.010811 | 0.010811 | 0.005405 | 0.016216 | 0.000000 | 0.021622 | 0.037838 | 0.005405 | 0.005405 | 0.821622 | 0.054054 | 0.010811 |
| SPLUNK INC | 0.010274 | 0.003425 | 0.013699 | 0.020548 | 0.013699 | 0.003425 | 0.023973 | 0.000000 | 0.003425 | 0.839041 | 0.058219 | 0.010274 |
| OKTA, INC. | 0.020305 | 0.000000 | 0.015228 | 0.050761 | 0.015228 | 0.005076 | 0.040609 | 0.000000 | 0.015228 | 0.786802 | 0.030457 | 0.020305 |
| VEEVA SYSTEMS INC | 0.093245 | 0.012845 | 0.094196 | 0.028544 | 0.035205 | 0.008563 | 0.019981 | 0.010466 | 0.017602 | 0.315414 | 0.352046 | 0.011893 |
| ... | ... | ... | ... | ... | ... | ... | ... | ... | ... | ... | ... | ... |
| AMERICAN REALTY CAPITAL NEW YORK CITY REIT, INC. | 0.075472 | 0.084906 | 0.122642 | 0.009434 | 0.471698 | 0.009434 | 0.075472 | 0.000000 | 0.000000 | 0.066038 | 0.084906 | 0.000000 |
| CYCLACEL PHARMACEUTICALS, INC. | 0.027460 | 0.000000 | 0.029748 | 0.272311 | 0.011442 | 0.009153 | 0.018307 | 0.308924 | 0.000000 | 0.029748 | 0.013730 | 0.279176 |
| ZOETIS INC. | 0.036519 | 0.018868 | 0.074254 | 0.033475 | 0.034084 | 0.013999 | 0.035301 | 0.018868 | 0.020694 | 0.053561 | 0.644553 | 0.015825 |
| STAG INDUSTRIAL, INC. | 0.181818 | 0.016529 | 0.066116 | 0.016529 | 0.132231 | 0.016529 | 0.396694 | 0.008264 | 0.033058 | 0.074380 | 0.057851 | 0.000000 |
| EQUINIX INC | 0.024768 | 0.003096 | 0.030960 | 0.006192 | 0.015480 | 0.012384 | 0.061920 | 0.009288 | 0.009288 | 0.801858 | 0.018576 | 0.006192 |
675 rows × 12 columns
Factor Modelling
The common factors in our factor model are the 12 topics selected from LDA model. We use the calculated probability matrix of each topic for each companies as the topic modelling matrix \(B\). Then a linear regression of returns matrix on topic modelling matrix will give us the coefficient matrix for the 12 factors.
At each time \(t\), we run a linear regression of \(r_t\) on the topic modelling matrix (common factor matrix) \(B\) to generate a coefficient vector for time \(t\). At the same time, a residual vector \(\epsilon_t\) can be calculated using the diffrence of the actual \(r_t\) along with the predicted value \(\hat r_t\).
After \(T\) times (31 months in our case) of linear regression, we have a coefficient matrix \(coef_{T\times m}\) with 12 topics as columns and 31 months as rows as well as a residual matrix with 31 months as columns and the number of companies as rows. We will construct the diagonal matrix \(D\) using the diagonal values of covariance of the resiudal matrix which are the variance of residuals \(\text{Var}(\epsilon_{i1}, \epsilon_{i2}, \dots, \epsilon_{iT})\) for each company.
Demonstration in Pharmaceutical Preparations Industry
# get the names of the companies in the pharmaceutical preparations industry
Pharm = df[df.SIC == 2834]
Pharm_list = Pharm.index
# get the companies name that match return data and business description data
SET = (set(Pharm_list) & set(r_selected.index))
LIST = [*SET, ]
B_matrix = prob.T[LIST].T
B_matrix = B_matrix[~B_matrix.index.duplicated(keep="first")]
Topic Matrix: \({B_{k \times m}}\)
| 0 | 1 | 2 | 3 | 4 | 5 | 6 | 7 | 8 | 9 | 10 | 11 | |
|---|---|---|---|---|---|---|---|---|---|---|---|---|
| name | ||||||||||||
| AQUINOX PHARMACEUTICALS, INC | 0.068259 | 0.003413 | 0.061433 | 0.607509 | 0.020478 | 0.003413 | 0.023891 | 0.071672 | 0.051195 | 0.040956 | 0.006826 | 0.040956 |
| ASSEMBLY BIOSCIENCES, INC. | 0.012658 | 0.000000 | 0.050633 | 0.012658 | 0.000000 | 0.012658 | 0.000000 | 0.594937 | 0.012658 | 0.025316 | 0.075949 | 0.202532 |
| MANNKIND CORP | 0.062500 | 0.015000 | 0.092500 | 0.370000 | 0.015000 | 0.025000 | 0.047500 | 0.125000 | 0.032500 | 0.105000 | 0.030000 | 0.080000 |
| RIGEL PHARMACEUTICALS INC | 0.018832 | 0.016949 | 0.047081 | 0.290019 | 0.011299 | 0.013183 | 0.007533 | 0.242938 | 0.013183 | 0.069680 | 0.071563 | 0.197740 |
| GALECTIN THERAPEUTICS INC | 0.016667 | 0.000000 | 0.050000 | 0.033333 | 0.000000 | 0.000000 | 0.008333 | 0.641667 | 0.016667 | 0.033333 | 0.000000 | 0.200000 |
| ... | ... | ... | ... | ... | ... | ... | ... | ... | ... | ... | ... | ... |
| ACHAOGEN INC | 0.034591 | 0.011006 | 0.048742 | 0.496855 | 0.022013 | 0.004717 | 0.023585 | 0.139937 | 0.026730 | 0.064465 | 0.062893 | 0.064465 |
| PULMATRIX, INC. | 0.030303 | 0.006061 | 0.009091 | 0.439394 | 0.009091 | 0.006061 | 0.021212 | 0.336364 | 0.009091 | 0.042424 | 0.015152 | 0.075758 |
| REGENERON PHARMACEUTICALS INC | 0.034420 | 0.009058 | 0.054348 | 0.329710 | 0.016304 | 0.016304 | 0.028986 | 0.175725 | 0.016304 | 0.047101 | 0.083333 | 0.188406 |
| CHIASMA, INC | 0.021739 | 0.000000 | 0.013043 | 0.230435 | 0.004348 | 0.017391 | 0.021739 | 0.617391 | 0.000000 | 0.021739 | 0.008696 | 0.043478 |
| IMPRIMIS PHARMACEUTICALS, INC. | 0.000000 | 0.000000 | 0.106509 | 0.349112 | 0.011834 | 0.017751 | 0.029586 | 0.142012 | 0.017751 | 0.106509 | 0.088757 | 0.130178 |
124 rows × 12 columns
r_Pharm = r_selected.T[LIST].T
coef_mat = pd.DataFrame(0, index = r_Pharm.columns, columns = range(n_components))
res_mat = pd.DataFrame(0, index = r_Pharm.index, columns = r_Pharm.columns)

from sklearn.linear_model import LinearRegression

for i in range(len(r_Pharm.columns)):
    LR = LinearRegression()
    date = r_Pharm.columns[i]
    r_t_i = r_Pharm[date]
    r_t_i_demean = r_t_i - r_t_i.mean()
    reg = LR.fit(B_matrix, r_t_i_demean)
    coef_mat.iloc[i] = reg.coef_
    prediction = B_matrix.dot(reg.coef_)
    residual_t_i = r_t_i_demean - prediction
    res_mat[date] = residual_t_i
Coefficient Matrix: \(coef_{T \times m}\)
| 0 | 1 | 2 | 3 | 4 | 5 | 6 | 7 | 8 | 9 | 10 | 11 | |
|---|---|---|---|---|---|---|---|---|---|---|---|---|
| 2016-06-30 | 0.993361 | -1.875375 | 0.195258 | -0.337758 | 1.312631 | 2.051489 | 1.238693 | -0.392438 | -2.489539 | -0.470602 | -0.236897 | 0.011175 |
| 2016-07-31 | -0.587373 | 2.486985 | -0.051766 | -0.119139 | 0.599033 | -0.509589 | 0.034452 | -0.130789 | -1.116928 | -0.347125 | 0.009258 | -0.267018 |
| 2016-08-31 | -0.088389 | -2.184883 | 0.309753 | 0.127562 | 0.202514 | -0.612011 | -1.106752 | 0.233257 | 1.801470 | 0.803841 | 0.164920 | 0.348719 |
| 2016-09-30 | -0.122107 | 1.875134 | 0.171593 | 0.108377 | 0.836037 | -0.015983 | -1.795211 | -0.121855 | -0.571359 | -0.409085 | 0.001294 | 0.043164 |
| 2016-10-31 | -0.236524 | -2.536547 | -0.143964 | -0.035811 | -0.187329 | 1.460662 | -0.469362 | -0.034221 | 1.959008 | 0.200099 | 0.077996 | -0.054007 |
| 2016-11-30 | -1.151701 | 1.936744 | 0.147886 | -0.116144 | 0.417320 | -1.095169 | -1.533299 | -0.054423 | 1.213919 | -0.113511 | 0.200694 | 0.147685 |
| 2016-12-31 | 0.483848 | -1.161150 | -0.100632 | -0.193967 | -0.265334 | 0.825843 | 0.407563 | -0.141296 | 1.436270 | -0.580140 | -0.186887 | -0.524118 |
| 2017-01-31 | -0.277906 | 1.977522 | 0.574171 | 0.256089 | -1.584684 | -3.236387 | 0.679985 | 0.346124 | 1.308807 | -0.275143 | 0.050787 | 0.180636 |
| 2017-02-28 | 0.895630 | 3.177223 | 0.208617 | -0.125386 | -3.827412 | -2.817838 | 0.297242 | 0.148517 | 2.594685 | -0.329282 | -0.044365 | -0.177630 |
| 2017-03-31 | -1.031747 | 1.838094 | 0.056902 | -0.172604 | -0.423448 | -1.919721 | -0.909357 | -0.001361 | 3.564327 | -0.665482 | -0.290407 | -0.045196 |
| 2017-04-30 | -0.211334 | -1.602075 | -0.224406 | -0.074999 | 1.339630 | 2.564717 | 1.782393 | -0.065947 | -3.099536 | -0.262565 | -0.009339 | -0.136537 |
| 2017-05-31 | 0.648542 | -0.663393 | 0.028541 | 0.062360 | 1.617295 | -0.347683 | 0.631139 | -0.103693 | -2.235411 | 0.330108 | -0.039340 | 0.071534 |
| 2017-06-30 | 0.463373 | -0.674562 | -0.236003 | 0.036023 | -1.249023 | 0.703260 | -0.299994 | -0.085970 | 1.889070 | -0.466909 | -0.000894 | -0.078371 |
| 2017-07-31 | 0.177977 | 2.140741 | -0.235111 | -0.194055 | -0.116186 | 0.649325 | -0.868795 | -0.172467 | -0.588006 | -0.213592 | -0.290586 | -0.289245 |
| 2017-08-31 | -0.186677 | 0.941224 | 0.053929 | -0.093700 | 1.319535 | -1.558089 | -0.083888 | -0.019411 | 0.684707 | -0.952684 | -0.019513 | -0.085431 |
| 2017-09-30 | 0.316972 | 3.418921 | 0.449367 | 0.154292 | -1.203242 | -4.995160 | -0.760192 | 0.307751 | 2.031288 | 0.106942 | 0.156732 | 0.016328 |
| 2017-10-31 | 1.102453 | 0.842594 | -0.141848 | -0.241794 | 0.370936 | -0.095343 | -0.453912 | -0.239645 | -0.450735 | -0.424791 | -0.172505 | -0.095411 |
| 2017-11-30 | 0.813015 | -1.930563 | -0.081636 | -0.256725 | -0.500748 | 0.846789 | -0.582951 | -0.160954 | 1.791315 | 0.320750 | -0.355372 | 0.097077 |
| 2017-12-31 | 0.917035 | 0.115870 | -0.266767 | -0.232480 | 0.053044 | 0.875878 | -0.565072 | -0.232319 | 0.126186 | -0.347361 | -0.248846 | -0.195167 |
| 2018-01-31 | 0.510904 | -1.424801 | 0.525894 | 0.376281 | -0.103350 | -2.715219 | -1.475502 | 0.339420 | 3.212658 | 0.237646 | 0.242735 | 0.273334 |
| 2018-02-28 | 0.092100 | -0.271018 | 0.392836 | -0.053891 | 1.497478 | -0.632567 | -0.492316 | -0.113717 | 0.696161 | -0.951320 | 0.025789 | -0.189535 |
| 2018-03-31 | 0.250350 | -0.051754 | -0.145994 | -0.254493 | 1.377327 | -0.671779 | 0.020492 | -0.394691 | 0.523717 | -0.575754 | -0.282293 | 0.204871 |
| 2018-04-30 | -0.306677 | -0.355225 | 0.010576 | 0.045465 | 0.429732 | 0.335406 | -1.145255 | 0.021852 | 0.837205 | 0.212868 | -0.017595 | -0.068353 |
| 2018-05-31 | 0.373257 | -2.238666 | 0.102341 | 0.062301 | -2.039520 | 3.767960 | 0.052930 | 0.080370 | -1.161794 | 0.381085 | 0.087377 | 0.532358 |
| 2018-06-30 | -0.562615 | 0.509221 | -0.566240 | -0.184665 | 0.417973 | 4.326845 | 0.844668 | -0.152939 | -5.142850 | 0.755770 | -0.093239 | -0.151928 |
| 2018-07-31 | -0.936502 | 0.468251 | -0.050995 | 0.024653 | -0.288721 | -0.567886 | 0.436411 | -0.073319 | 1.170531 | -0.030022 | -0.052548 | -0.099853 |
| 2018-08-31 | -1.410095 | -1.756273 | 0.335407 | 0.328625 | 1.468389 | -0.571324 | -0.224952 | 0.310353 | 0.193843 | 0.839583 | 0.175877 | 0.310568 |
| 2018-09-30 | 0.666432 | -0.886211 | 0.482306 | 0.478674 | -1.332732 | -0.169247 | 1.223540 | 0.287162 | -1.172659 | 0.241639 | 0.186752 | -0.005655 |
| 2018-10-31 | 0.309981 | 2.743814 | -0.470120 | -0.223289 | -1.423760 | 1.122517 | 0.128998 | -0.210256 | -1.681892 | 0.404869 | -0.318367 | -0.382494 |
| 2018-11-30 | 0.430086 | -2.222911 | 0.248783 | -0.114050 | -0.226333 | 1.541043 | -0.856399 | -0.140060 | 1.962801 | -0.443735 | 0.035656 | -0.214880 |
| 2018-12-31 | 0.691217 | -0.083460 | -0.044176 | -0.109118 | 0.947424 | -0.069292 | -0.720454 | -0.163557 | 0.323619 | -0.386821 | -0.210655 | -0.174728 |
Residual Matrix
res_mat
| 2016-06-30 | 2016-07-31 | 2016-08-31 | 2016-09-30 | 2016-10-31 | 2016-11-30 | 2016-12-31 | 2017-01-31 | 2017-02-28 | 2017-03-31 | ... | 2018-03-31 | 2018-04-30 | 2018-05-31 | 2018-06-30 | 2018-07-31 | 2018-08-31 | 2018-09-30 | 2018-10-31 | 2018-11-30 | 2018-12-31 | |
|---|---|---|---|---|---|---|---|---|---|---|---|---|---|---|---|---|---|---|---|---|---|
| name | |||||||||||||||||||||
| AQUINOX PHARMACEUTICALS, INC | 0.154922 | 0.376646 | 0.055042 | 0.187457 | -0.089496 | 0.370412 | 0.280747 | -0.214152 | -0.195240 | -0.038969 | ... | 0.110603 | -0.155788 | 0.063595 | -0.404264 | 0.138140 | -0.214698 | -0.394826 | 0.271679 | -0.092694 | 0.131095 |
| ASSEMBLY BIOSCIENCES, INC. | 0.326680 | 0.107196 | -0.181379 | 0.178080 | 1.111857 | -0.157130 | 0.162014 | 0.216233 | -0.036756 | 0.206368 | ... | 0.104757 | -0.113084 | -0.337129 | 0.105990 | 0.225364 | -0.423837 | -0.281614 | -0.005226 | 0.201520 | 0.207516 |
| MANNKIND CORP | 0.456006 | -0.058118 | -0.369472 | -0.230926 | -0.171823 | 0.191022 | 0.489506 | -0.123330 | -0.364644 | -0.337926 | ... | -0.048994 | -0.237040 | -0.063584 | 0.086175 | -0.138489 | -0.531817 | 0.353167 | 0.263774 | 0.020654 | -0.129442 |
| RIGEL PHARMACEUTICALS INC | 0.196890 | 0.083178 | 0.254775 | 0.006443 | -0.101194 | -0.065924 | 0.173420 | -0.390079 | 0.100915 | 0.397049 | ... | 0.120304 | 0.018212 | -0.355162 | -0.005518 | 0.059101 | -0.110906 | -0.291213 | 0.204859 | 0.105055 | 0.122484 |
| GALECTIN THERAPEUTICS INC | 0.380841 | 0.227081 | -0.237329 | -0.320427 | -0.187439 | 0.091932 | 0.410407 | -0.367103 | 0.701588 | 0.154896 | ... | 0.387516 | -0.288879 | 0.266132 | 0.498471 | -0.121522 | -0.061167 | -0.302299 | 0.100248 | 0.252778 | 0.022014 |
| ... | ... | ... | ... | ... | ... | ... | ... | ... | ... | ... | ... | ... | ... | ... | ... | ... | ... | ... | ... | ... | ... |
| ACHAOGEN INC | 0.504481 | 0.095034 | -0.233910 | 0.196890 | 0.131270 | 0.241172 | 1.458790 | -0.041756 | 0.372147 | 0.127169 | ... | 0.422389 | 0.096134 | -0.270544 | -0.071477 | -0.148716 | -0.574215 | -0.553092 | 0.306263 | -0.502079 | 0.037460 |
| PULMATRIX, INC. | 0.170737 | 0.150913 | -0.451489 | 0.032823 | -0.028021 | -0.489517 | 0.176836 | 2.342886 | 0.811992 | -0.070448 | ... | -0.398212 | -0.102640 | -0.151729 | 0.100987 | 0.080103 | -0.358161 | -0.498207 | 0.326749 | 0.102522 | -0.045197 |
| REGENERON PHARMACEUTICALS INC | 0.123785 | 0.289575 | -0.262475 | -0.028181 | 0.035840 | 0.093260 | 0.177957 | -0.262176 | -0.007960 | 0.124937 | ... | 0.219150 | -0.094996 | -0.274320 | 0.285485 | 0.131329 | -0.182917 | -0.271993 | 0.180788 | 0.162024 | 0.315493 |
| CHIASMA, INC | 0.246003 | -0.008955 | -0.244587 | 0.208747 | -0.049651 | -0.069338 | 0.162285 | -0.270802 | -0.312447 | 0.142753 | ... | 0.277882 | -0.017701 | -0.223102 | 0.072804 | 0.023282 | 0.365140 | 0.200864 | 0.335350 | 0.198473 | 0.095848 |
| IMPRIMIS PHARMACEUTICALS, INC. | 0.248464 | 0.114470 | -0.170438 | -0.108541 | -0.162678 | -0.005414 | 0.139754 | -0.337944 | 0.090436 | 0.812665 | ... | 0.172954 | 0.288501 | -0.301488 | 0.085804 | 0.098330 | -0.097924 | -0.381156 | 0.884198 | 0.179173 | 0.537175 |
124 rows × 31 columns
Diagonal Matrix: \(D_{k \times k}\)
\(D = diag(\sigma^2_1, \dots, \sigma^2_k) \text{ and Var}(\epsilon_i) = \sigma^2_i\)
D_mat = pd.DataFrame(np.diag(np.diag(res_mat.T.cov()))).set_index(B_matrix.index)
D_mat.columns = B_matrix.index
D_mat
| name | AQUINOX PHARMACEUTICALS, INC | ASSEMBLY BIOSCIENCES, INC. | MANNKIND CORP | RIGEL PHARMACEUTICALS INC | GALECTIN THERAPEUTICS INC | FORTRESS BIOTECH, INC. | BIOSPECIFICS TECHNOLOGIES CORP | BIOMARIN PHARMACEUTICAL INC | LEXICON PHARMACEUTICALS, INC. | WAVE LIFE SCIENCES LTD. | ... | SAREPTA THERAPEUTICS, INC. | AMICUS THERAPEUTICS INC | CHEMBIO DIAGNOSTICS, INC. | NATURES SUNSHINE PRODUCTS INC | HEAT BIOLOGICS, INC. | ACHAOGEN INC | PULMATRIX, INC. | REGENERON PHARMACEUTICALS INC | CHIASMA, INC | IMPRIMIS PHARMACEUTICALS, INC. |
|---|---|---|---|---|---|---|---|---|---|---|---|---|---|---|---|---|---|---|---|---|---|
| name | |||||||||||||||||||||
| AQUINOX PHARMACEUTICALS, INC | 0.049207 | 0.000000 | 0.000000 | 0.00000 | 0.000000 | 0.0 | 0.0 | 0.0 | 0.0 | 0.0 | ... | 0.0 | 0.0 | 0.0 | 0.0 | 0.0 | 0.00000 | 0.00000 | 0.0000 | 0.000000 | 0.000000 |
| ASSEMBLY BIOSCIENCES, INC. | 0.000000 | 0.091779 | 0.000000 | 0.00000 | 0.000000 | 0.0 | 0.0 | 0.0 | 0.0 | 0.0 | ... | 0.0 | 0.0 | 0.0 | 0.0 | 0.0 | 0.00000 | 0.00000 | 0.0000 | 0.000000 | 0.000000 |
| MANNKIND CORP | 0.000000 | 0.000000 | 0.109918 | 0.00000 | 0.000000 | 0.0 | 0.0 | 0.0 | 0.0 | 0.0 | ... | 0.0 | 0.0 | 0.0 | 0.0 | 0.0 | 0.00000 | 0.00000 | 0.0000 | 0.000000 | 0.000000 |
| RIGEL PHARMACEUTICALS INC | 0.000000 | 0.000000 | 0.000000 | 0.04958 | 0.000000 | 0.0 | 0.0 | 0.0 | 0.0 | 0.0 | ... | 0.0 | 0.0 | 0.0 | 0.0 | 0.0 | 0.00000 | 0.00000 | 0.0000 | 0.000000 | 0.000000 |
| GALECTIN THERAPEUTICS INC | 0.000000 | 0.000000 | 0.000000 | 0.00000 | 0.085131 | 0.0 | 0.0 | 0.0 | 0.0 | 0.0 | ... | 0.0 | 0.0 | 0.0 | 0.0 | 0.0 | 0.00000 | 0.00000 | 0.0000 | 0.000000 | 0.000000 |
| ... | ... | ... | ... | ... | ... | ... | ... | ... | ... | ... | ... | ... | ... | ... | ... | ... | ... | ... | ... | ... | ... |
| ACHAOGEN INC | 0.000000 | 0.000000 | 0.000000 | 0.00000 | 0.000000 | 0.0 | 0.0 | 0.0 | 0.0 | 0.0 | ... | 0.0 | 0.0 | 0.0 | 0.0 | 0.0 | 0.14366 | 0.00000 | 0.0000 | 0.000000 | 0.000000 |
| PULMATRIX, INC. | 0.000000 | 0.000000 | 0.000000 | 0.00000 | 0.000000 | 0.0 | 0.0 | 0.0 | 0.0 | 0.0 | ... | 0.0 | 0.0 | 0.0 | 0.0 | 0.0 | 0.00000 | 0.24829 | 0.0000 | 0.000000 | 0.000000 |
| REGENERON PHARMACEUTICALS INC | 0.000000 | 0.000000 | 0.000000 | 0.00000 | 0.000000 | 0.0 | 0.0 | 0.0 | 0.0 | 0.0 | ... | 0.0 | 0.0 | 0.0 | 0.0 | 0.0 | 0.00000 | 0.00000 | 0.0365 | 0.000000 | 0.000000 |
| CHIASMA, INC | 0.000000 | 0.000000 | 0.000000 | 0.00000 | 0.000000 | 0.0 | 0.0 | 0.0 | 0.0 | 0.0 | ... | 0.0 | 0.0 | 0.0 | 0.0 | 0.0 | 0.00000 | 0.00000 | 0.0000 | 0.046287 | 0.000000 |
| IMPRIMIS PHARMACEUTICALS, INC. | 0.000000 | 0.000000 | 0.000000 | 0.00000 | 0.000000 | 0.0 | 0.0 | 0.0 | 0.0 | 0.0 | ... | 0.0 | 0.0 | 0.0 | 0.0 | 0.0 | 0.00000 | 0.00000 | 0.0000 | 0.000000 | 0.088088 |
124 rows × 124 columns
Covariance from Factor Model: \(\Sigma_{R\{k \times k\}}\)
cov_Factor_Model = pd.DataFrame(np.array(B_matrix.dot(coef_mat.cov()).dot(B_matrix.T)) +
                                np.diag(np.diag(res_mat.T.cov()))).set_index(B_matrix.index)
cov_Factor_Model.columns = B_matrix.index
cov_Factor_Model
| name | AQUINOX PHARMACEUTICALS, INC | ASSEMBLY BIOSCIENCES, INC. | MANNKIND CORP | RIGEL PHARMACEUTICALS INC | GALECTIN THERAPEUTICS INC | FORTRESS BIOTECH, INC. | BIOSPECIFICS TECHNOLOGIES CORP | BIOMARIN PHARMACEUTICAL INC | LEXICON PHARMACEUTICALS, INC. | WAVE LIFE SCIENCES LTD. | ... | SAREPTA THERAPEUTICS, INC. | AMICUS THERAPEUTICS INC | CHEMBIO DIAGNOSTICS, INC. | NATURES SUNSHINE PRODUCTS INC | HEAT BIOLOGICS, INC. | ACHAOGEN INC | PULMATRIX, INC. | REGENERON PHARMACEUTICALS INC | CHIASMA, INC | IMPRIMIS PHARMACEUTICALS, INC. |
|---|---|---|---|---|---|---|---|---|---|---|---|---|---|---|---|---|---|---|---|---|---|
| name | |||||||||||||||||||||
| AQUINOX PHARMACEUTICALS, INC | 0.082664 | 0.027580 | 0.021975 | 0.023906 | 0.031289 | 0.022151 | 0.017689 | 0.026934 | 0.015996 | 0.022890 | ... | 0.024623 | 0.026814 | 0.017966 | 0.017976 | 0.025234 | 0.027905 | 0.026684 | 0.022341 | 0.024222 | 0.025094 |
| ASSEMBLY BIOSCIENCES, INC. | 0.027580 | 0.121400 | 0.021564 | 0.025520 | 0.032224 | 0.021936 | 0.020872 | 0.025931 | 0.021005 | 0.024203 | ... | 0.024283 | 0.026607 | 0.020009 | 0.015124 | 0.030050 | 0.025998 | 0.026621 | 0.022971 | 0.026178 | 0.026942 |
| MANNKIND CORP | 0.021975 | 0.021564 | 0.128645 | 0.019494 | 0.023330 | 0.016550 | 0.016915 | 0.020663 | 0.016230 | 0.019876 | ... | 0.019500 | 0.021384 | 0.018122 | 0.014170 | 0.021800 | 0.020677 | 0.021561 | 0.018664 | 0.021170 | 0.021865 |
| RIGEL PHARMACEUTICALS INC | 0.023906 | 0.025520 | 0.019494 | 0.072990 | 0.027582 | 0.019454 | 0.019165 | 0.023705 | 0.019305 | 0.022260 | ... | 0.022541 | 0.024455 | 0.020153 | 0.014569 | 0.027107 | 0.023675 | 0.024321 | 0.021053 | 0.023424 | 0.024748 |
| GALECTIN THERAPEUTICS INC | 0.031289 | 0.032224 | 0.023330 | 0.027582 | 0.120964 | 0.023394 | 0.021352 | 0.028389 | 0.021646 | 0.025895 | ... | 0.026476 | 0.028824 | 0.019961 | 0.016570 | 0.032010 | 0.028752 | 0.029106 | 0.024567 | 0.028157 | 0.028425 |
| ... | ... | ... | ... | ... | ... | ... | ... | ... | ... | ... | ... | ... | ... | ... | ... | ... | ... | ... | ... | ... | ... |
| ACHAOGEN INC | 0.027905 | 0.025998 | 0.020677 | 0.023675 | 0.028752 | 0.021043 | 0.018753 | 0.025612 | 0.017820 | 0.022553 | ... | 0.023734 | 0.025881 | 0.020043 | 0.016172 | 0.025490 | 0.169572 | 0.025857 | 0.021777 | 0.024290 | 0.025221 |
| PULMATRIX, INC. | 0.026684 | 0.026621 | 0.021561 | 0.024321 | 0.029106 | 0.020715 | 0.020334 | 0.026036 | 0.019779 | 0.023535 | ... | 0.024154 | 0.026431 | 0.020827 | 0.015695 | 0.026326 | 0.025857 | 0.275105 | 0.022459 | 0.026065 | 0.026166 |
| REGENERON PHARMACEUTICALS INC | 0.022341 | 0.022971 | 0.018664 | 0.021053 | 0.024567 | 0.018554 | 0.018188 | 0.022061 | 0.017901 | 0.021015 | ... | 0.020891 | 0.022790 | 0.019760 | 0.013850 | 0.024470 | 0.021777 | 0.022459 | 0.056436 | 0.021823 | 0.023276 |
| CHIASMA, INC | 0.024222 | 0.026178 | 0.021170 | 0.023424 | 0.028157 | 0.019913 | 0.020919 | 0.024883 | 0.020438 | 0.022984 | ... | 0.022901 | 0.025401 | 0.020539 | 0.014173 | 0.025562 | 0.024290 | 0.026065 | 0.021823 | 0.072737 | 0.025849 |
| IMPRIMIS PHARMACEUTICALS, INC. | 0.025094 | 0.026942 | 0.021865 | 0.024748 | 0.028425 | 0.021703 | 0.021905 | 0.025278 | 0.021344 | 0.024408 | ... | 0.024026 | 0.026551 | 0.025019 | 0.016308 | 0.028788 | 0.025221 | 0.026166 | 0.023276 | 0.025849 | 0.116258 |
124 rows × 124 columns
Perform Mean-Variance Analysis
For demonstration, we only use the Pharmaceutical Preparations industry data to generate portfolio based on Mean-Variance Analysis. We estimate the covariance matrix based on the factor model constructed above.
from pypfopt import EfficientFrontier
from pypfopt import risk_models
from pypfopt import expected_returns
from pypfopt import objective_functions
from pypfopt import plotting
Sample Mean for the Pharmaceutical Preparations Industry
mu_Pharm = mu[LIST]
mu_Pharm
name
AQUINOX PHARMACEUTICALS, INC     -0.004622
ASSEMBLY BIOSCIENCES, INC.        0.072839
MANNKIND CORP                    -0.002810
RIGEL PHARMACEUTICALS INC         0.011020
GALECTIN THERAPEUTICS INC         0.064165
                                    ...
ACHAOGEN INC                      0.007742
PULMATRIX, INC.                   0.009480
REGENERON PHARMACEUTICALS INC     0.002351
CHIASMA, INC                      0.018143
IMPRIMIS PHARMACEUTICALS, INC.    0.031240
Length: 124, dtype: float64
Sample Covariance for the Pharmaceutical Preparations Industry
tmp = cov[LIST].T
cov_Pharm = tmp[LIST]
cov_Pharm
| name | AQUINOX PHARMACEUTICALS, INC | ASSEMBLY BIOSCIENCES, INC. | MANNKIND CORP | RIGEL PHARMACEUTICALS INC | GALECTIN THERAPEUTICS INC | FORTRESS BIOTECH, INC. | BIOSPECIFICS TECHNOLOGIES CORP | BIOMARIN PHARMACEUTICAL INC | LEXICON PHARMACEUTICALS, INC. | WAVE LIFE SCIENCES LTD. | ... | SAREPTA THERAPEUTICS, INC. | AMICUS THERAPEUTICS INC | CHEMBIO DIAGNOSTICS, INC. | NATURES SUNSHINE PRODUCTS INC | HEAT BIOLOGICS, INC. | ACHAOGEN INC | PULMATRIX, INC. | REGENERON PHARMACEUTICALS INC | CHIASMA, INC | IMPRIMIS PHARMACEUTICALS, INC. |
|---|---|---|---|---|---|---|---|---|---|---|---|---|---|---|---|---|---|---|---|---|---|
| name | |||||||||||||||||||||
| AQUINOX PHARMACEUTICALS, INC | 0.044662 | -0.000043 | -0.001594 | 0.009369 | 0.002725 | 0.009361 | 0.002458 | 0.004787 | 0.008030 | 0.010651 | ... | 0.006712 | 0.007105 | -0.001749 | 0.006418 | 0.020250 | 0.022941 | 0.008470 | 0.001158 | 0.004271 | -0.000662 |
| ASSEMBLY BIOSCIENCES, INC. | -0.000043 | 0.071030 | -0.008567 | -0.006169 | -0.014516 | 0.005300 | -0.006172 | -0.001668 | -0.002814 | 0.018593 | ... | -0.005024 | 0.002169 | 0.001177 | -0.004359 | 0.004144 | -0.000960 | 0.045995 | -0.006473 | -0.006780 | -0.017609 |
| MANNKIND CORP | -0.001594 | -0.008567 | 0.099741 | -0.004992 | -0.008867 | -0.002842 | -0.002372 | -0.004764 | -0.005258 | 0.001322 | ... | -0.011109 | -0.006724 | -0.000207 | 0.006063 | -0.004294 | 0.004404 | 0.007041 | -0.000822 | 0.020805 | -0.031491 |
| RIGEL PHARMACEUTICALS INC | 0.009369 | -0.006169 | -0.004992 | 0.033500 | 0.015401 | 0.008834 | 0.000461 | 0.000356 | 0.000150 | 0.012268 | ... | 0.010023 | 0.003802 | -0.000883 | 0.004908 | 0.021613 | 0.000028 | -0.006501 | -0.000615 | 0.005843 | 0.014332 |
| GALECTIN THERAPEUTICS INC | 0.002725 | -0.014516 | -0.008867 | 0.015401 | 0.083509 | 0.021772 | 0.002357 | 0.009969 | 0.016729 | -0.008727 | ... | 0.002776 | 0.011818 | 0.012040 | 0.001235 | 0.001660 | 0.014341 | 0.031317 | 0.006681 | -0.001683 | 0.006423 |
| ... | ... | ... | ... | ... | ... | ... | ... | ... | ... | ... | ... | ... | ... | ... | ... | ... | ... | ... | ... | ... | ... |
| ACHAOGEN INC | 0.022941 | -0.000960 | 0.004404 | 0.000028 | 0.014341 | 0.012751 | 0.007767 | 0.000741 | 0.004936 | -0.008309 | ... | -0.001360 | -0.001465 | -0.000546 | -0.001501 | -0.018732 | 0.097615 | 0.031299 | -0.003298 | -0.011172 | -0.004221 |
| PULMATRIX, INC. | 0.008470 | 0.045995 | 0.007041 | -0.006501 | 0.031317 | 0.003358 | -0.009037 | 0.011645 | 0.016356 | 0.006861 | ... | 0.016898 | 0.021201 | -0.012933 | -0.015419 | -0.008802 | 0.031299 | 0.306222 | -0.001204 | -0.000617 | -0.007801 |
| REGENERON PHARMACEUTICALS INC | 0.001158 | -0.006473 | -0.000822 | -0.000615 | 0.006681 | 0.006683 | 0.001614 | 0.004185 | 0.005760 | -0.005950 | ... | 0.006381 | 0.004394 | 0.000644 | 0.004890 | 0.000815 | -0.003298 | -0.001204 | 0.009307 | 0.003194 | -0.001211 |
| CHIASMA, INC | 0.004271 | -0.006780 | 0.020805 | 0.005843 | -0.001683 | 0.000563 | 0.006284 | 0.001363 | 0.000866 | 0.006205 | ... | 0.018008 | 0.000039 | -0.003681 | 0.000256 | 0.000472 | -0.011172 | -0.000617 | 0.003194 | 0.049106 | -0.000313 |
| IMPRIMIS PHARMACEUTICALS, INC. | -0.000662 | -0.017609 | -0.031491 | 0.014332 | 0.006423 | -0.002731 | 0.002582 | 0.000078 | -0.004131 | 0.001506 | ... | -0.006600 | -0.003028 | -0.006985 | 0.000745 | 0.002129 | -0.004221 | -0.007801 | -0.001211 | -0.000313 | 0.045175 |
124 rows × 124 columns
Correlation Matric Converted from Covariance Matrix of Factor Model
def correlation_from_covariance(covariance):
    v = np.sqrt(np.diag(covariance))
    outer_v = np.outer(v, v)
    correlation = covariance / outer_v
    correlation[covariance == 0] = 0
    return correlation
cor_Factor_Model = correlation_from_covariance(cov_Factor_Model)
cor_Factor_Model
| name | AQUINOX PHARMACEUTICALS, INC | ASSEMBLY BIOSCIENCES, INC. | MANNKIND CORP | RIGEL PHARMACEUTICALS INC | GALECTIN THERAPEUTICS INC | FORTRESS BIOTECH, INC. | BIOSPECIFICS TECHNOLOGIES CORP | BIOMARIN PHARMACEUTICAL INC | LEXICON PHARMACEUTICALS, INC. | WAVE LIFE SCIENCES LTD. | ... | SAREPTA THERAPEUTICS, INC. | AMICUS THERAPEUTICS INC | CHEMBIO DIAGNOSTICS, INC. | NATURES SUNSHINE PRODUCTS INC | HEAT BIOLOGICS, INC. | ACHAOGEN INC | PULMATRIX, INC. | REGENERON PHARMACEUTICALS INC | CHIASMA, INC | IMPRIMIS PHARMACEUTICALS, INC. |
|---|---|---|---|---|---|---|---|---|---|---|---|---|---|---|---|---|---|---|---|---|---|
| name | |||||||||||||||||||||
| AQUINOX PHARMACEUTICALS, INC | 1.000000 | 0.275315 | 0.213099 | 0.307769 | 0.312901 | 0.287328 | 0.269061 | 0.372618 | 0.263411 | 0.295830 | ... | 0.264436 | 0.358893 | 0.245833 | 0.306985 | 0.249898 | 0.235693 | 0.176946 | 0.327089 | 0.312367 | 0.255979 |
| ASSEMBLY BIOSCIENCES, INC. | 0.275315 | 1.000000 | 0.172552 | 0.271105 | 0.265919 | 0.234792 | 0.261976 | 0.296029 | 0.285437 | 0.258116 | ... | 0.215190 | 0.293873 | 0.225926 | 0.213127 | 0.245561 | 0.181195 | 0.145670 | 0.277525 | 0.278575 | 0.226780 |
| MANNKIND CORP | 0.213099 | 0.172552 | 1.000000 | 0.201177 | 0.187022 | 0.172079 | 0.206249 | 0.229151 | 0.214251 | 0.205922 | ... | 0.167875 | 0.229431 | 0.198774 | 0.193983 | 0.173055 | 0.139994 | 0.114610 | 0.219045 | 0.218847 | 0.178793 |
| RIGEL PHARMACEUTICALS INC | 0.307769 | 0.271105 | 0.201177 | 1.000000 | 0.293535 | 0.268544 | 0.310234 | 0.349001 | 0.338327 | 0.306166 | ... | 0.257617 | 0.348344 | 0.293460 | 0.264772 | 0.285683 | 0.212805 | 0.171630 | 0.328031 | 0.321473 | 0.268653 |
| GALECTIN THERAPEUTICS INC | 0.312901 | 0.265919 | 0.187022 | 0.293535 | 1.000000 | 0.250846 | 0.268485 | 0.324680 | 0.294671 | 0.276666 | ... | 0.235048 | 0.318933 | 0.225793 | 0.233916 | 0.262056 | 0.200754 | 0.159552 | 0.297337 | 0.300183 | 0.239696 |
| ... | ... | ... | ... | ... | ... | ... | ... | ... | ... | ... | ... | ... | ... | ... | ... | ... | ... | ... | ... | ... | ... |
| ACHAOGEN INC | 0.235693 | 0.181195 | 0.139994 | 0.212805 | 0.200754 | 0.190580 | 0.199167 | 0.247398 | 0.204895 | 0.203510 | ... | 0.177966 | 0.241863 | 0.191483 | 0.192821 | 0.176249 | 1.000000 | 0.119718 | 0.222611 | 0.218711 | 0.179628 |
| PULMATRIX, INC. | 0.176946 | 0.145670 | 0.114610 | 0.171630 | 0.159552 | 0.147289 | 0.169547 | 0.197445 | 0.178543 | 0.166734 | ... | 0.142191 | 0.193925 | 0.156215 | 0.146926 | 0.142911 | 0.119718 | 1.000000 | 0.180248 | 0.184258 | 0.146311 |
| REGENERON PHARMACEUTICALS INC | 0.327089 | 0.277525 | 0.219045 | 0.328031 | 0.297337 | 0.291276 | 0.334824 | 0.369376 | 0.356767 | 0.328710 | ... | 0.271535 | 0.369177 | 0.327227 | 0.286254 | 0.293280 | 0.222611 | 0.180248 | 1.000000 | 0.340613 | 0.287350 |
| CHIASMA, INC | 0.312367 | 0.278575 | 0.218847 | 0.321473 | 0.300183 | 0.275359 | 0.339220 | 0.366987 | 0.358804 | 0.316674 | ... | 0.262186 | 0.362446 | 0.299608 | 0.258031 | 0.269868 | 0.218711 | 0.184258 | 0.340613 | 1.000000 | 0.281093 |
| IMPRIMIS PHARMACEUTICALS, INC. | 0.255979 | 0.226780 | 0.178793 | 0.268653 | 0.239696 | 0.237385 | 0.280960 | 0.294891 | 0.296377 | 0.265997 | ... | 0.217571 | 0.299665 | 0.288679 | 0.234838 | 0.240394 | 0.179628 | 0.146311 | 0.287350 | 0.281093 | 1.000000 |
124 rows × 124 columns
Estimated Covariance
sd = pd.DataFrame(np.sqrt(np.diag(np.diagonal(cov_Pharm))))
sd = sd.set_index(cov_Pharm.index)
sd.columns = cov_Pharm.index
Factor_Model_cov = pd.DataFrame((np.dot(np.dot(sd, cor_Factor_Model),sd))).set_index(cor_Factor_Model.index)
Factor_Model_cov.columns = cor_Factor_Model.index
Factor_Model_cov
| name | AQUINOX PHARMACEUTICALS, INC | ASSEMBLY BIOSCIENCES, INC. | MANNKIND CORP | RIGEL PHARMACEUTICALS INC | GALECTIN THERAPEUTICS INC | FORTRESS BIOTECH, INC. | BIOSPECIFICS TECHNOLOGIES CORP | BIOMARIN PHARMACEUTICAL INC | LEXICON PHARMACEUTICALS, INC. | WAVE LIFE SCIENCES LTD. | ... | SAREPTA THERAPEUTICS, INC. | AMICUS THERAPEUTICS INC | CHEMBIO DIAGNOSTICS, INC. | NATURES SUNSHINE PRODUCTS INC | HEAT BIOLOGICS, INC. | ACHAOGEN INC | PULMATRIX, INC. | REGENERON PHARMACEUTICALS INC | CHIASMA, INC | IMPRIMIS PHARMACEUTICALS, INC. |
|---|---|---|---|---|---|---|---|---|---|---|---|---|---|---|---|---|---|---|---|---|---|
| name | |||||||||||||||||||||
| AQUINOX PHARMACEUTICALS, INC | 0.044662 | 0.015507 | 0.014223 | 0.011905 | 0.019109 | 0.011316 | 0.004450 | 0.006625 | 0.008248 | 0.012029 | ... | 0.016209 | 0.010009 | 0.005952 | 0.008725 | 0.017869 | 0.015562 | 0.020693 | 0.006669 | 0.014628 | 0.011498 |
| ASSEMBLY BIOSCIENCES, INC. | 0.015507 | 0.071030 | 0.014524 | 0.013225 | 0.020480 | 0.011662 | 0.005464 | 0.006638 | 0.011272 | 0.013236 | ... | 0.016635 | 0.010335 | 0.006899 | 0.007639 | 0.022144 | 0.015088 | 0.021484 | 0.007136 | 0.016452 | 0.012846 |
| MANNKIND CORP | 0.014223 | 0.014524 | 0.099741 | 0.011629 | 0.017069 | 0.010128 | 0.005097 | 0.006089 | 0.010026 | 0.012512 | ... | 0.015378 | 0.009562 | 0.007192 | 0.008239 | 0.018492 | 0.013814 | 0.020030 | 0.006674 | 0.015316 | 0.012002 |
| RIGEL PHARMACEUTICALS INC | 0.011905 | 0.013225 | 0.011629 | 0.033500 | 0.015526 | 0.009160 | 0.004444 | 0.005374 | 0.009175 | 0.010782 | ... | 0.013677 | 0.008413 | 0.006154 | 0.006518 | 0.017692 | 0.012169 | 0.017384 | 0.005792 | 0.013039 | 0.010451 |
| GALECTIN THERAPEUTICS INC | 0.019109 | 0.020480 | 0.017069 | 0.015526 | 0.083509 | 0.013509 | 0.006072 | 0.007894 | 0.012617 | 0.015383 | ... | 0.019702 | 0.012162 | 0.007476 | 0.009091 | 0.025623 | 0.018126 | 0.025515 | 0.008289 | 0.019223 | 0.014722 |
| ... | ... | ... | ... | ... | ... | ... | ... | ... | ... | ... | ... | ... | ... | ... | ... | ... | ... | ... | ... | ... | ... |
| ACHAOGEN INC | 0.015562 | 0.015088 | 0.013814 | 0.012169 | 0.018126 | 0.011097 | 0.004870 | 0.006503 | 0.009485 | 0.012234 | ... | 0.016128 | 0.009972 | 0.006854 | 0.008102 | 0.018632 | 0.097615 | 0.020698 | 0.006710 | 0.015142 | 0.011928 |
| PULMATRIX, INC. | 0.020693 | 0.021484 | 0.020030 | 0.017384 | 0.025515 | 0.015189 | 0.007342 | 0.009192 | 0.014639 | 0.017752 | ... | 0.022823 | 0.014161 | 0.009904 | 0.010935 | 0.026758 | 0.020698 | 0.306222 | 0.009623 | 0.022595 | 0.017209 |
| REGENERON PHARMACEUTICALS INC | 0.006669 | 0.007136 | 0.006674 | 0.005792 | 0.008289 | 0.005237 | 0.002528 | 0.002998 | 0.005100 | 0.006101 | ... | 0.007598 | 0.004700 | 0.003617 | 0.003714 | 0.009573 | 0.006710 | 0.009623 | 0.009307 | 0.007282 | 0.005892 |
| CHIASMA, INC | 0.014628 | 0.016452 | 0.015316 | 0.013039 | 0.019223 | 0.011371 | 0.005883 | 0.006842 | 0.011781 | 0.013502 | ... | 0.016852 | 0.010599 | 0.007607 | 0.007690 | 0.020234 | 0.015142 | 0.022595 | 0.007282 | 0.049106 | 0.013239 |
| IMPRIMIS PHARMACEUTICALS, INC. | 0.011498 | 0.012846 | 0.012002 | 0.010451 | 0.014722 | 0.009403 | 0.004673 | 0.005273 | 0.009334 | 0.010878 | ... | 0.013413 | 0.008405 | 0.007030 | 0.006713 | 0.017288 | 0.011928 | 0.017209 | 0.005892 | 0.013239 | 0.045175 |
124 rows × 124 columns
Efficient Frontier - Pharmaceutical Preparations
ef1 = EfficientFrontier(mu_Pharm, Factor_Model_cov, weight_bounds=(0, 0.2))

fig, ax = plt.subplots()
plotting.plot_efficient_frontier(ef1, ax=ax, show_assets=True)

# Find and plot the tangency portfolio
ef2 = EfficientFrontier(mu_Pharm, Factor_Model_cov, weight_bounds=(0, 0.2))
# min volatility
ef2.min_volatility()
ret_tangent, std_tangent, _ = ef2.portfolio_performance()
ax.scatter(std_tangent, ret_tangent, marker="*", s=100, c="r", label="Min Volatility")

# Format
ax.set_title("Efficient Frontier - Pharmaceutical Preparations \n Factor Model Estimates")
ax.legend()
plt.tight_layout()
plt.savefig('images/Efficient_Frontier_Returns_Pharmaceutical_Preparations.png', dpi=200, bbox_inches='tight')
plt.show()
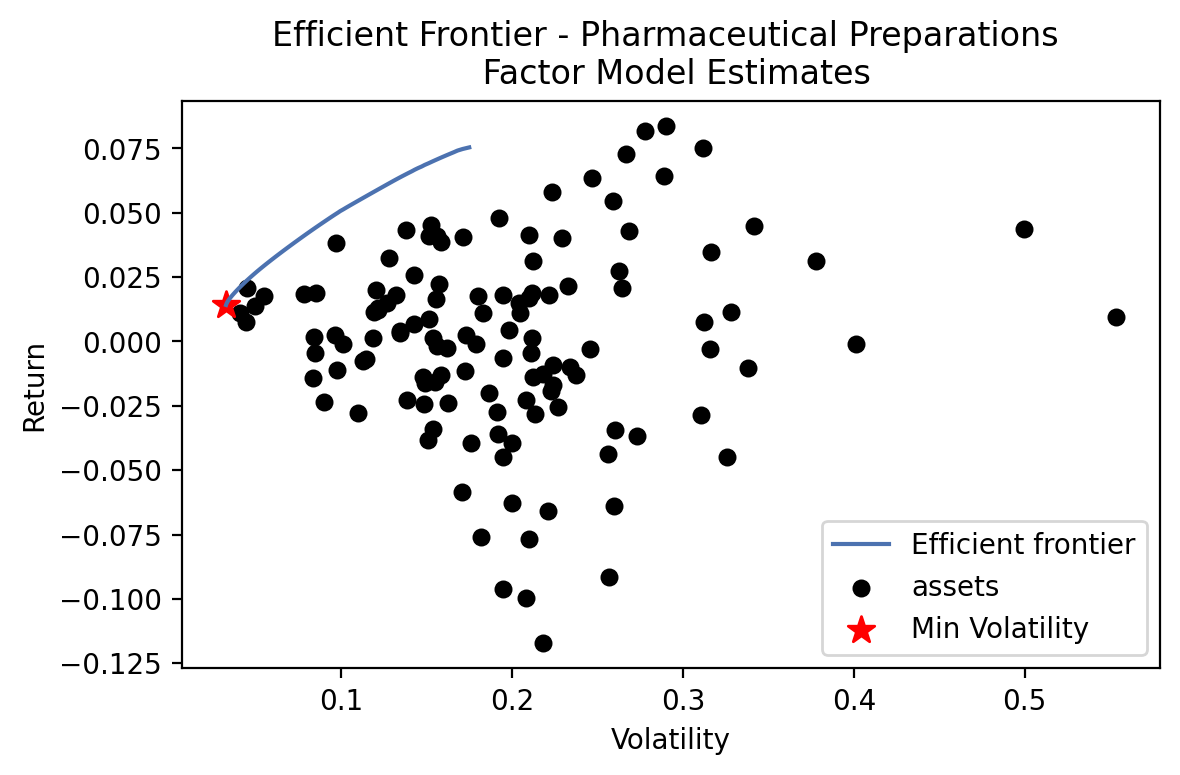
Min Volatility Portfolio
Performance
ef2.portfolio_performance(verbose=True);
Expected annual return: 1.4%
Annual volatility: 3.3%
Sharpe Ratio: -0.18
Weights
companies = []
weights = []
for company, weight in ef2.clean_weights().items():
    if weight != 0:
        companies.append(company)
        weights.append(weight)

dic = {'Company_Name':companies,'Weight':weights}
min_vol = pd.DataFrame(dic)
min_vol.to_csv("data/min_vol_factor_model_Pharmaceutical_Preparations.csv", index = False)
| Company_Name | Weight | |
|---|---|---|
| 0 | BIOSPECIFICS TECHNOLOGIES CORP | 0.0175 |
| 1 | JOHNSON & JOHNSON | 0.2000 |
| 2 | PFIZER INC | 0.2000 |
| 3 | ZOETIS INC. | 0.2000 |
| 4 | LILLY ELI & CO | 0.1825 |
| 5 | MERCK & CO., INC. | 0.2000 |
Results for the Other 4 Industries
Prepackaged Software (mass reproduction of software)
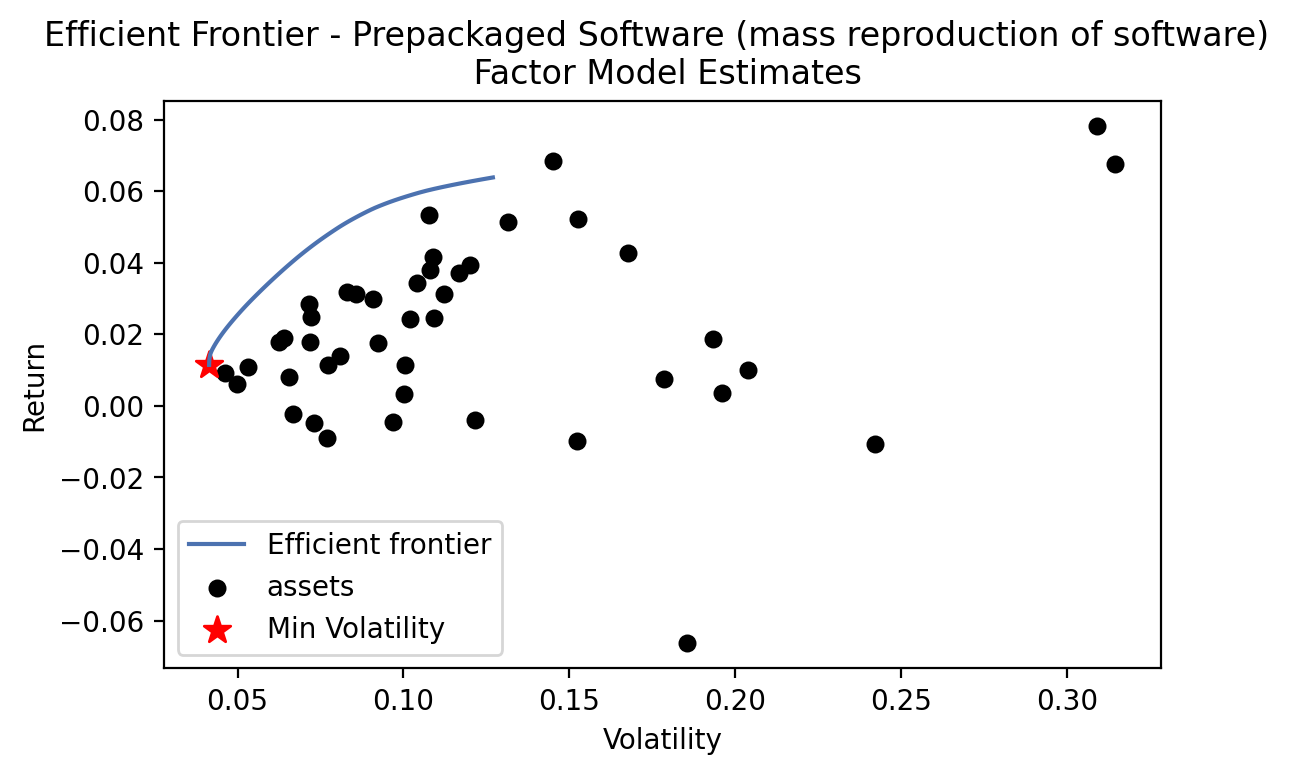
Min Volatility Portfolio
Performance
Expected annual return: 1.1%
Annual volatility: 4.1%
Sharpe Ratio: -0.21
Weights
| Company_Name | Weight | |
|---|---|---|
| 0 | AWARE INC /MA/ | 0.06064 |
| 1 | ULTIMATE SOFTWARE GROUP INC | 0.05857 |
| 2 | ORACLE CORP | 0.20000 |
| 3 | NATIONAL INSTRUMENTS CORP | 0.11657 |
| 4 | ACI WORLDWIDE, INC. | 0.20000 |
| 5 | REALPAGE INC | 0.02255 |
| 6 | BLACK KNIGHT, INC. | 0.20000 |
| 7 | ANSYS INC | 0.03257 |
| 8 | SALESFORCE COM INC | 0.09549 |
| 9 | POLARITYTE, INC. | 0.01095 |
| 10 | MICROSTRATEGY INC | 0.00228 |
| 11 | Q2 HOLDINGS, INC. | 0.00038 |
Crude Petroleum and Natural Gas
When we conduct the same analysis, there is no weight shown. Efficient frontier cannot be found.
Real Estate Investment Trusts
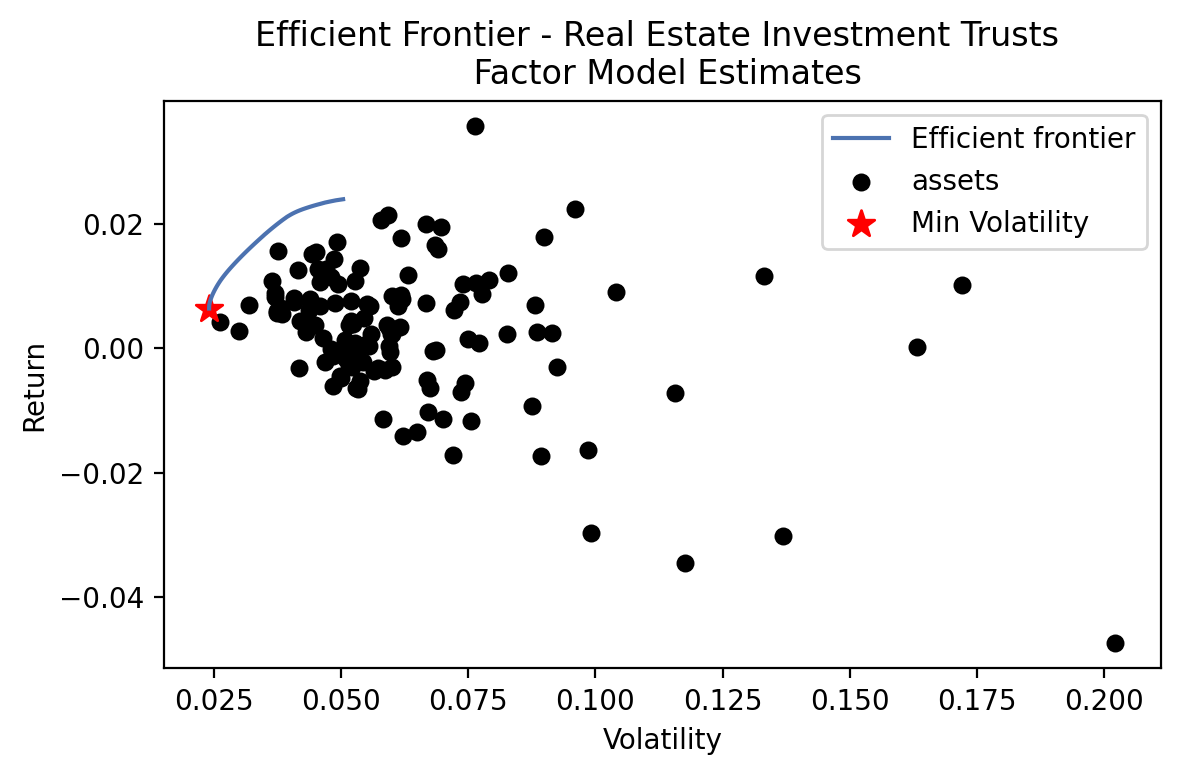
Min Volatility Portfolio
Performance
Expected annual return: 0.6%
Annual volatility: 2.4%
Sharpe Ratio: -0.57
Weights
| Company_Name | Weight | |
|---|---|---|
| 0 | ARES COMMERCIAL REAL ESTATE CORP | 0.09357 |
| 1 | TWO HARBORS INVESTMENT CORP. | 0.05921 |
| 2 | GREAT AJAX CORP. | 0.20000 |
| 3 | GAMING & LEISURE PROPERTIES, INC. | 0.04173 |
| 4 | MFA FINANCIAL, INC. | 0.00089 |
| 5 | EQUITY COMMONWEALTH | 0.20000 |
| 6 | PUBLIC STORAGE | 0.01551 |
| 7 | ALEXANDRIA REAL ESTATE EQUITIES INC | 0.07207 |
| 8 | STARWOOD PROPERTY TRUST, INC. | 0.20000 |
| 9 | ESSEX PROPERTY TRUST INC | 0.03164 |
| 10 | SUN COMMUNITIES INC | 0.05974 |
| 11 | UDR, INC. | 0.02051 |
| 12 | RAYONIER INC | 0.00513 |
State Commercial Banks (commercial banking)
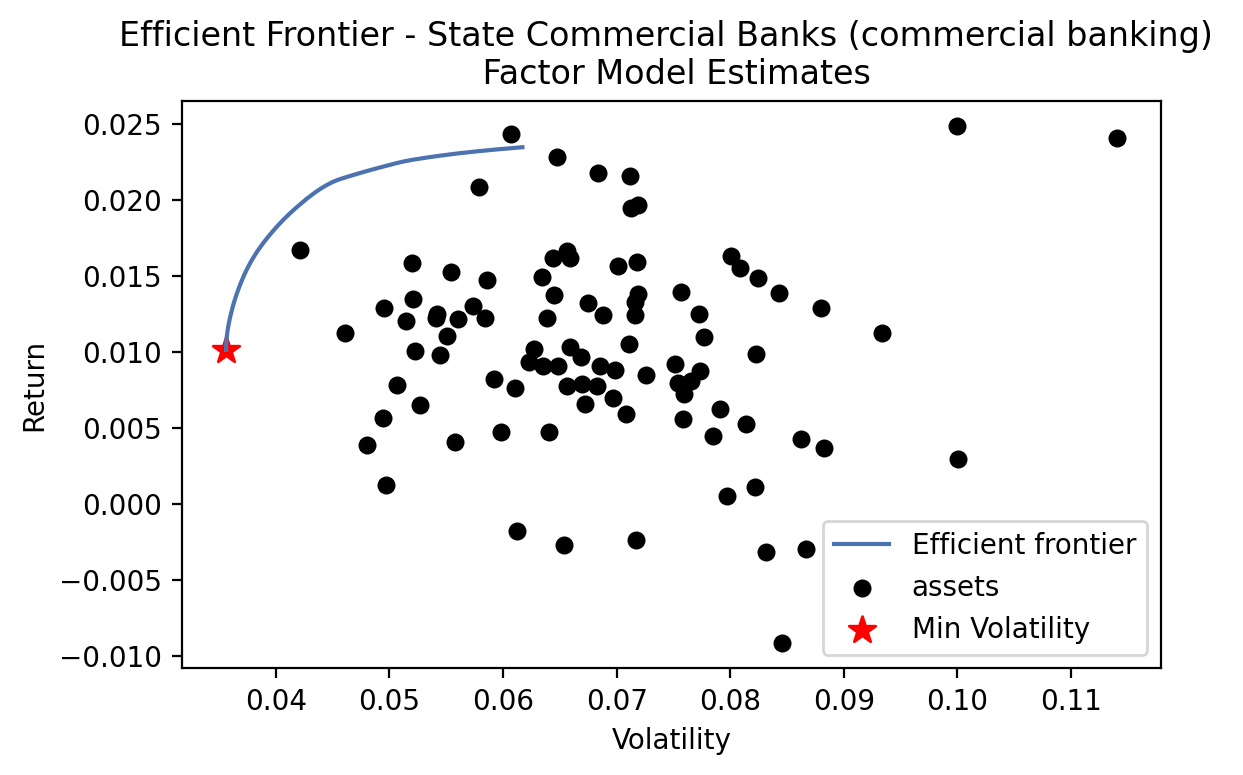
Min Volatility Portfolio
Performance
Expected annual return: 1.0%
Annual volatility: 3.6%
Sharpe Ratio: -0.28
Weights
| Company_Name | Weight | |
|---|---|---|
| 0 | INVESTAR HOLDING CORP | 0.20000 |
| 1 | GUARANTY FEDERAL BANCSHARES INC | 0.08886 |
| 2 | CITIZENS & NORTHERN CORP | 0.03483 |
| 3 | BANK OF NEW YORK MELLON CORP | 0.02348 |
| 4 | HOPFED BANCORP INC | 0.09023 |
| 5 | MACKINAC FINANCIAL CORP /MI/ | 0.17768 |
| 6 | BANK OF THE JAMES FINANCIAL GROUP INC | 0.12467 |
| 7 | VILLAGE BANK & TRUST FINANCIAL CORP. | 0.03140 |
| 8 | COMMERCE BANCSHARES INC /MO/ | 0.04634 |
| 9 | CB FINANCIAL SERVICES, INC. | 0.06201 |
| 10 | BANK OF HAWAII CORP | 0.08409 |
| 11 | OLD LINE BANCSHARES INC | 0.03641 |